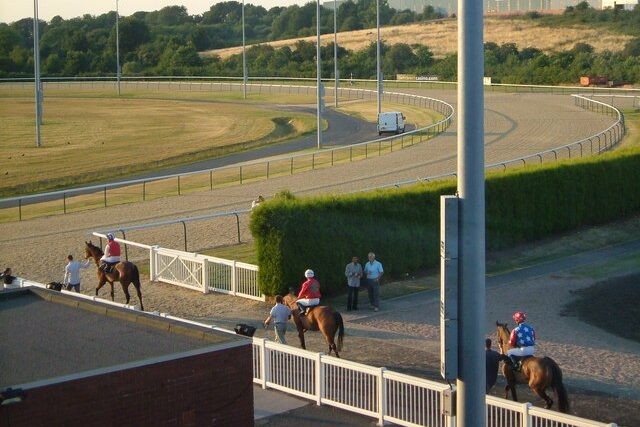
Does the draw affect the performance of the horse at Wolverhampton?
All races are run on the round course, with the 7f distance starting from a chute:
Wolverhampton 6f Draw Bias
There have been 359 races since 2017 so an even bigger sample. Here are the draw splits in terms of win percentage:
Lower Third: 36.7%
Middle Third: 36.5%
Upper Third: 26.7%
As you can see, this is a much more level playing field than the 5f. But what about the PRB figures? Percentage of Rivals Beaten (PRB) is a calculation based on a horse’s finishing position in relation to field size. It makes key distinctions between a horse finishing third in a five-horse race (PRB 50%, two rivals beaten, beaten by two rivals) and finishing third in an eleven-horse race (PRB 80%, eight rivals beaten, beaten by two rivals):
Lower Third: 0.53
Middle Third: 0.52
Upper Third: 0.45
It seems that high draws are again at a disadvantage. However, low and middle draws are now on par with each other.
When you combine the four lowest stalls in every race it gives us a combined strike rate of 10.7%. Backing all of those draws in every race would have yielded a loss of 15p in the £ to SP. Combining draws 10 to 13 has given a strike rate of just 5.1% and would have produced losses of 40p in the £. Therefore, it seems that daws 1 to 4 are much less unprofitable than draws 10 to 13. However, it’s not a profitable angle in itself.
If you want you quality horse racing tips sent to you daily then look no further and start your 14-day trial of Ron Williams Racing horse racing tipster service.

